


How can we know that our Permaculture design is caring for the Earth?
Next level Permaculture designing.

There’s a lot of stuff in this article and some of it is mathematical. You can always skip those bits but the results are interesting :-) We’ve got some stuff on the Shannon-Weiner index, environmental network analysis, Keystone species, wild areas and other cool stuff. I really enjoyed writing this article I hope you enjoy reading it!
Details matter. Teaching and informing people about important details matters a lot. As an example, a few years ago some people showed me photographs of their swales. A few months later they sent me some photos of their ex-swales. Shortly after having paid someone to dig them, they got hit by a 1 in 500 year storm. The swales got washed downhill and ended up in the neighbours house. What was the lost but important detail? Design and build in a strategically placed and sized overflow point.
There are any number of self-acclaimed tutos on the web, some are great but far too many miss details and have no contextual information. This is something that gets up my nose and tends to make Permaculture (PmC) look amateur. Techniques and strategies are contextual, a companion planting guild may work well in one place and not at all in another. The same is true of building techniques, conflict resolution approaches, micro-economic strategies, whatever.
Another level.
Earthcare is a core ethical guideline in PmC design. How do you work out if your Permaculture design is, in reality, caring for the Earth?
Our main metric is biodiversity, this is based on the idea that more biodiversity is good. It is also based on the theory that higher levels of biodiversity mean more system robustness and resilience. The loss of one species doesn’t cause an ecosystem collapse because there is species redundancy. Linked to this is the concept of interdependency, these are the links and flows between the species in an ecosystem. These are both nutrient and information flows as I wrote about in this article.

Shannon-Wiener Index
In general higher biodiversity means more complex interconnections which means greater system dynamic stability and resilience. But what is biodiversity and how do we assess it, can it be measured?
One approach is to use Shannon-Wiener Index to assess the evolution of our project over 3 years, or more. (this may sound complicated so I’ll reveal an easy way later on). To start off, we need to understand two key concepts:
The number of species is referred to as species ‘richness’.
The relative numbers within each species (its population) is called ‘evenness’.
For example, last year the population of netted slugs (Deroceras reticulatum) in my market gardens went off the scale. Slugs had never been a problem here before. This meant that the species ‘evenness’ of my gardens was reduced, it was less even.
Mollison, as we are constantly reminded, said something like ‘you don’t have too many slugs, you don’t have enough ducks.’ What he is saying is that increasing species richness, by introducing another animal into the system, can cause it to become more ‘even’. The ducks increase the biodiversity of my gardens.
To recapitulate, an area that has a high species richness and a high evenness is one that has high biodiversity.
Back to the idea that PmC designers use biodiversity change as a measure of how well an installed design ‘cares for the Earth’. It’s all well and good to say that this is what we do, the deeper question is how do we do it? Let’s say that we measure species richness and evenness before we start installing the design and then we do it again 3 years later (for example), how do we compare the figures? The Shannon-Wiener Index can help with this, there are a number of different formulae but this one gets the job done.
H' = -Σ (p_i \cdot \ln(p_i))
(Yes, it looks scary but, as I said, I’ll show how to make it really easy lower down!!)
Where:
p_i = proportion of individuals of each species = n/Nn / N
N = total number of individuals across all species.
n = the number of individuals for each species.
Sorry about that. Here’s an example:
Step 1: Gather the data for year 1, before we start installing the design.
Species A (dominant): 100 individuals
Species B: 25 individuals
Species C: 15 individuals
Species D: 10 individuals
Species E: 5 individuals
The total number of individuals (N) is: N = 100 + 25 + 15 + 10 + 5 = 155
Step 2: Calculate Proportions (pip_i)
For each species:
Species A: pi=100/155≈0.6452p_i = 100 / 155 ≈ 0.6452
Species B: pi=25/155≈0.1613p_i = 25 / 155 ≈ 0.1613
Species C: pi=15/155≈0.0968p_i = 15 / 155 ≈ 0.0968
Species D: pi=10/155≈0.0645p_i = 10 / 155 ≈ 0.0645
Species E: pi=5/155≈0.0323p_i = 5 / 155 ≈ 0.0323
Step 3: Calculate pi⋅ln(pi)p_i \cdot \ln(p_i)
Using ln(pi)\ln(p_i) (natural logarithm of pip_i):
Species A: 0.6452⋅ln(0.6452)=0.6452⋅(−0.4382)≈−0.28280.6452 \cdot \ln(0.6452) = 0.6452 \cdot (-0.4382) ≈ -0.2828
Species B: 0.1613⋅ln(0.1613)=0.1613⋅(−1.8224)≈−0.29390.1613 \cdot \ln(0.1613) = 0.1613 \cdot (-1.8224) ≈ -0.2939
Species C: 0.0968⋅ln(0.0968)=0.0968⋅(−2.3321)≈−0.22570.0968 \cdot \ln(0.0968) = 0.0968 \cdot (-2.3321) ≈ -0.2257
Species D: 0.0645⋅ln(0.0645)=0.0645⋅(−2.7427)≈−0.17690.0645 \cdot \ln(0.0645) = 0.0645 \cdot (-2.7427) ≈ -0.1769
Species E: 0.0323⋅ln(0.0323)=0.0323⋅(−3.4321)≈−0.11080.0323 \cdot \ln(0.0323) = 0.0323 \cdot (-3.4321) ≈ -0.1108
Step 4: Sum the Values
Now, sum all pi⋅ln(pi)p_i \cdot \ln(p_i): Σ (p_i \cdot \ln(p_i)) = -0.2828 + -0.2939 + -0.2257 + -0.1769 + -0.1108 ≈ -1.0901
Step 5: Apply the Formula
Finally, calculate H': H' = -Σ (p_i \cdot \ln(p_i)) H' = -(-1.0901) = 1.0901
Result:
The Shannon-Wiener Index for this ecosystem, before we start installing, is about 1.09.
Step 6: Gather data in year 3
Our count shows that we have more species and greater evenness.
Species A: 50 individuals
Species B: 45 individuals
Species C: 40 individuals
Species D: 55 individuals
Species E: 50 individuals
Species F: 60 individuals
Species G: 45 individuals
Species H: 55 individuals
Species I: 40 individuals
Species J: 60 individuals
The total number of individuals (N) is: N = 50 + 45 + 40 + 55 + 50 + 60 + 45 + 55 + 40 + 60 = 500
Repeat all the other steps with the new figures:
Result:
The Shannon-Wiener Index for this example with 10 species and increased evenness is approximately 2.49.
1.0901 to 2.49. The results show that the design has helped the system become diverse/even, robust (its capacity to resist disturbance), and resilient (its capacity to recover after a shock). It will most likely be more adaptable too, a key consideration in today’s world of changing climates and species migration. Well done whoever designed it.
If, however, we discover the opposite then something is very wrong and we need to redesign.
Perhaps the idea of going out and counting species (richness) and working out their evenness does your head in?
In that case, we evoke the PmC principle of ‘least effort for maximum effect’. We can get the job done in such a way that our effort will be mainly making tea and coffee and perhaps offering some biscuits.
Step 1. Find an ecosystem that is species-rich in Brainiacs. They tend to accumulate in Colleges and Universities, (and down the Pub). (If you feel happy with doing the species counting but not with the calculations then a friendly local bookmaker should be able to help out.)
Step 2. Explain what you are doing and how it’s a wonderful opportunity for some of them to use your place as a study project.
Step 3. Use the ‘attractive force’ of tea/coffee and biscuits to get them to come and to keep them going.
Keystone species
OK, so the idea of having a bunch of students wandering around doesn’t appeal to you. In that case, we can focus our attention on keystone species, ones that play a critical role in maintaining the structure, diversity, and function of their ecological communities.
We set up some vegetable gardens and we notice that there are relatively few earthworms. If our system has been well designed, and is well managed, then by year 3 there should be many, many more and a greater variety of worm species. They aerate the soil as they burrow and improve nutrient availability through their castings. They tend to increase overall system biodiversity.
We can use the relative abundance and changes in abundance of pollinator insects (bees, butterflies etc), frogs and toads, mycorrhizal Fungi, and spiders as indicators of increasing/decreasing system biodiversity, robustness, and resilience. Combining a few together is best.
But Permaculture isn’t just about gardening you shout!
Urban areas
We use the same approach.
Step 1: Get the data
Assume the following population distribution:
Humans: 1,000 individuals
Cats: 30 individuals
Pigeons: 50 individuals
Rats: 20 individuals
Dogs: 10 individuals
The total number of individuals (N) is: N = 1,000 + 30 + 50 + 20 + 10 = 1,110
Step 2. Socks off and fingers out to do the calculation:
Result:
The Shannon-Wiener Index for this urban neighborhood is approximately 0.45. Whoops, very low biodiversity, low richness, and high unevenness because there are so many people. An ecosystem that is over-dominated by one species is one that has lower redundancy, robustness, and resilience.
We can reduce the number of people by encouraging de-urbanisation and reducing in-migration through PmC rural transition strategies. This will increase evenness. We can increase species richness by opening up more green spaces, getting more trees in there, increase the number of water bodies, and reduce pollution. This will help improve the quality of life for one and all and help increase urban resilience and robustness.
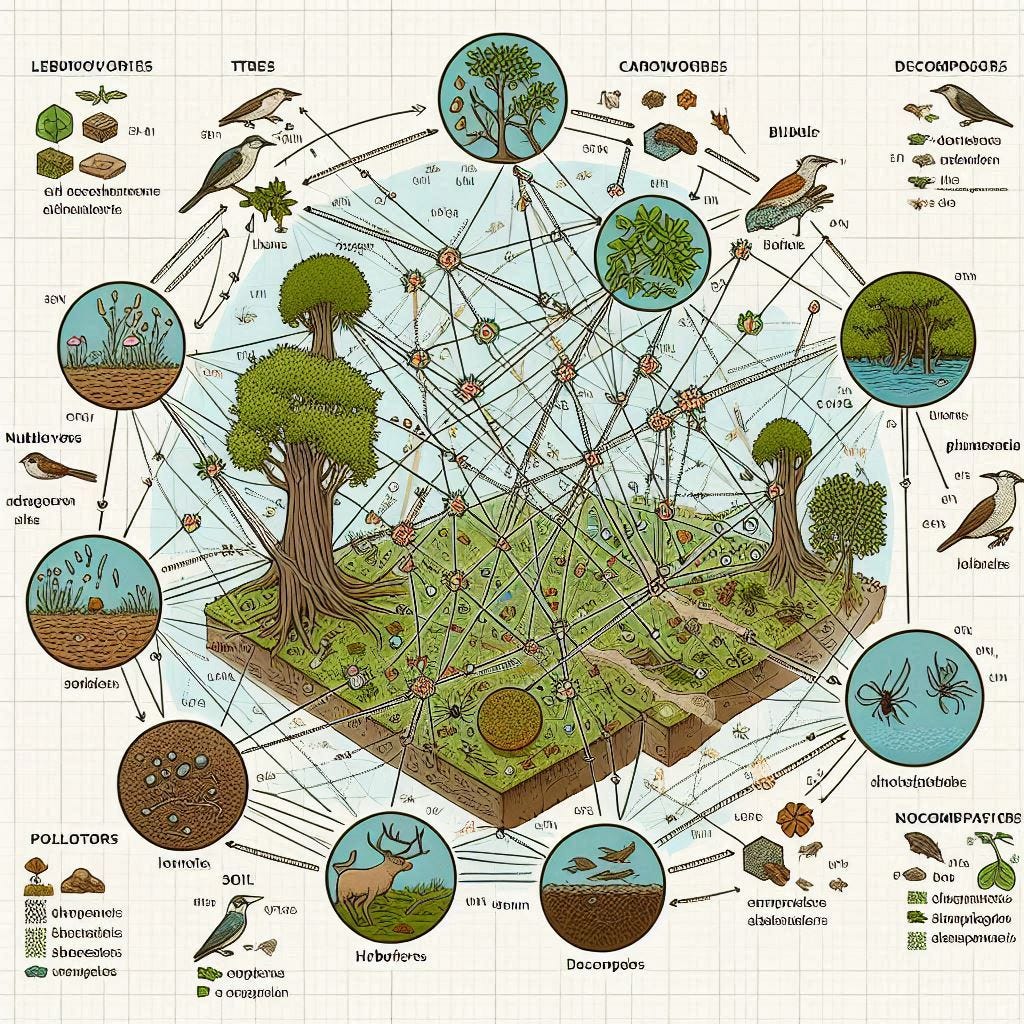
Ecological network analysis.
The above index is a useful tool for analysing the evolution of species richness and evenness. We should also consider how well everyone is getting along with each other within the system. A useful tool for this is ENA as it looks at food webs (who is eating whom and getting eaten by whom?) Connections, (who is sharing with whom?) Complexity, (who is dancing with whom and what sort of dance?)
How does that all work then?
Take a node, any node …. A node is a component in a system.
Let’s start with a primary producer node and go with an apple tree.
Then we’ve got consumers, herbivorous birds pecking at the apples and getting eaten themselves by carnivores like cats or hawks.
We’ve got decomposers, like fungi, breaking down organic and recycling the nutrients.
Finally, we’ve got scavengers feeding off the fallen apples, rats, boar etc.
The nodes are linked through trophic flows, Apple trees → herbivores → carnivores → decomposers. They are also linked by non-trophic flows such as bees pollinating flowers.
Then we can do some analysing.
How big are the flows between nodes? For example how many apples get eaten by birds? How quickly are earthworms decomposing the organic matter? How well are flowers being pollinated?
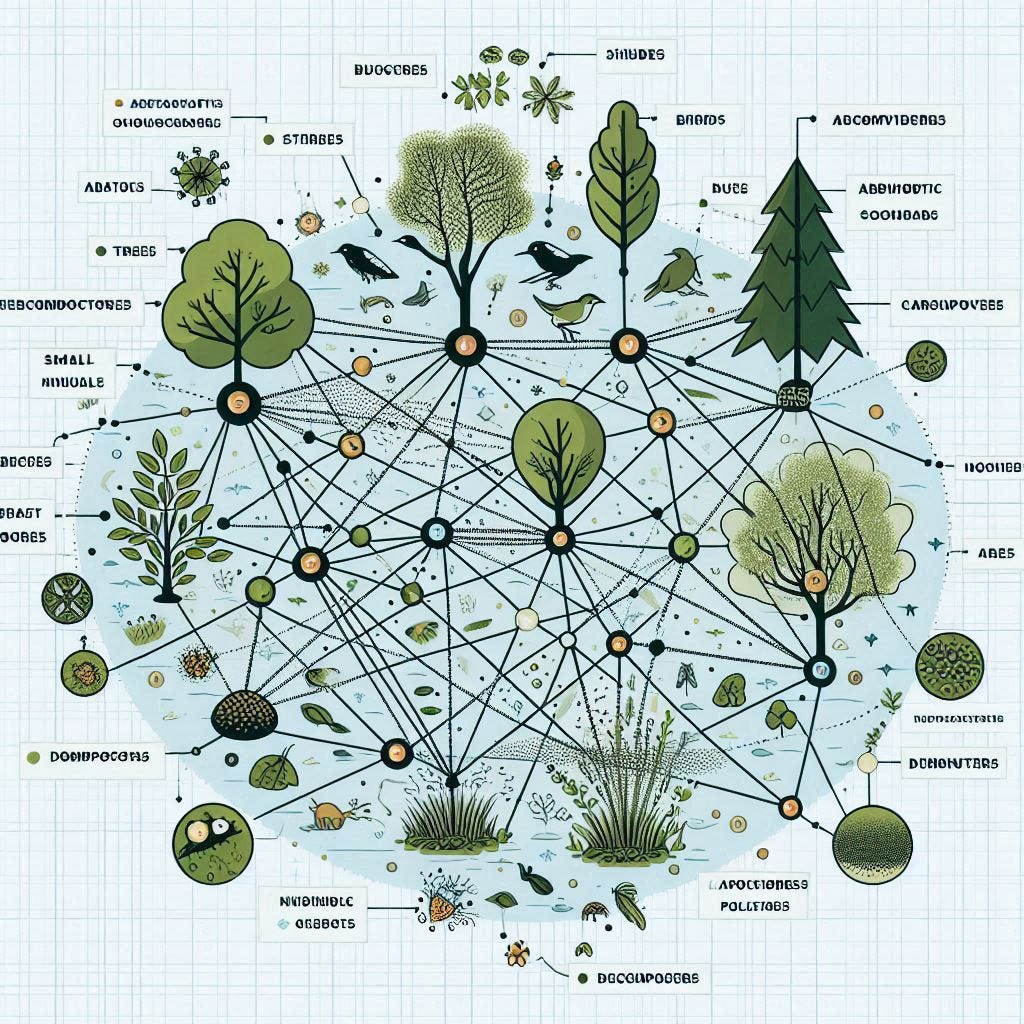
How well integrated is the system? This ties directly to the Permaculture principle ‘all the elements of a system must be connected together’ and ‘a product that isn’t used by the system is a form of pollution’. A well-integrated system has high connectivity, lots of links between elements, and lots of stuff flowing along them. We analyse the species that have the greatest impact, the so-called keystone species. How many of them are there and how well are they doing the job? Robustness and resilience need looking at too, by how much will our planned plantings increase them?
Where the environmental networks are well-developed and robust then we have a system that is resilient and adaptive. Where the nodes and flows are few then the system is brittle and the loss of a species can cause a cascade effect leading to its collapse. Plenty of nodes and effective connections means that the system can explore new organisational solutions when confronted by climatic or hydrological change.
As we are often designing projects for people we have to take into consideration their impact on a system and that of their companions. A dog can negatively impact species richness and evenness. This doesn’t just happen because they chase after wildlife, they leave information in the form of scents, urine and, feces. This information stays in the environment and changes the behaviour of the local wildlife. Foxes, for example, tend to move away. This can mean a local increase in small mammals that are an important reservoir for black-legged ticks. These ticks often carry Borrelia bacteria which cause Lymes disease. Dog = fewer foxes = more small mammals being infected = more Lymes disease.
Sophisticated designing means finding ways to reduce the impact of domestic dogs and cats on the local environment. It also means designing integrated systems for the other domesticated animals, sheep, cows, llamas etc. that the inhabitants want around.
Wild, semi-wild, and wetland areas.
This is a bit like cheating but in a good way. If I want to supercharge a rural or urban site’s progression towards robustness, resilience, and adaptability then I’ll design in some of the above. Design is the operative word here, we don’t do it any old how. A badly designed water body can decrease species richness because animals drown in it. A badly placed wild area can be too susceptible to wildfire and its loss will reduce species richness and evenness. I don’t know what it’s like where you are but the wild areas here have deer and boar roaming them. this means that the cultivated areas have to be protected from these animals or the species diversity and abundance of the market gardens gets hammered. Well-designed means correctly positioned and linked together with complex flows.
The Whole thing.
PmC design is about systems and so designs include buildings, hydrology, economies, hydrology, and, pretty much everything.
Each part of the integrated design should increase biodiversity. When they do so they increase robustness, resilience, and adaptability.
Permaculture-designed local economic systems are based on ecological economics, we can use the Shannon-Wiener Index to calculate the impact of the local economy on local biodiversity. As the economy transitions the results over the years should show that local biodiversity is increasing and thriving.
We can also use the index to see how well the local economy is working. I will explore this in a future article looking at metrics and analyses around that other Permaculture ethic ‘Peoplecare.’
A friend pointed out that ‘with Permaculture design we can do just about anything but we don’t do it any old how’. Doing analyses, such as the one above, helps ensure that this is the case. They also help us check that the system is going the ‘Permaculture way’, towards greater abundance, robustness, resilience, and adaptability. They tend to look great too.
Excellent. Like the maths. Would be easy for a brainiac to set the equations up in a spreadsheet to do all the number crunching.
I have long argued the need to be able to evaluate the effectiveness of a permaculture design based around the Earthcare ethic and presented this strongly during my time as an expert witness in low impact development (sitting alongside Tony Wrench and Paul Wimbush!) for part of the Welsh Governments consultation and formulation of the One Planet Development planning permission. Sadly I couldn’t swing it and we have ended up with an extremely complicated and frankly, largely inappropriate method.
From Earthcare I derive the essential things for us to get right as air, water, soil, biomass and biodiversity, probably in that order of priority. Air relates to atmospheric pollutants emitted by the occupants and activities on the site. Water should be cleaner and there should be more of it stored on site. Soil should be accumulating, not eroding. Biomass is simply how much organic stuff there is above and on the ground and biodiversity, number of species. It’s the combination and integration of these elements that generates and sustains life. Again, as you suggest, calling in help (offering opportunities for study) means we don’t have to do it all ourselves but I think most of the above could be measured relatively easily, before and later.
I think I’ll go and have a play with a spreadsheet…